
当今出色的 AI 智能体 依靠 检索增强生成 (RAG) 来实现更准确的结果。一个 RAG 系统通过利用知识库,为 大语言模型 (LLM) 提供增强的上下文支持。典型的架构模式包含一个 RAG 服务器,该服务器接收提示查询,向向量数据库检索最相近的上下文向量,再将附带相关上下文的查询发送至 LLM 服务,从而生成恰当的响应。
NVIDIA RAG Blueprint 是一个参考示例,旨在加速 RAG 在企业环境中的部署。它提供模块化的组件,涵盖提取、矢量化、检索和生成等环节,同时支持元数据过滤、查询重写、重排序以及多模态嵌入等可配置功能。该方案既支持简单的 Docker 部署,也支持面向生产的 Kubernetes 部署。
RAG 工作负载可能不可预测且具有突发性,需求可能在高峰时段(例如,晨间新闻周期、病毒式事件或季度末报告)突然激增,而在非高峰时段则下降至接近零。若缺乏自动扩展能力,企业将面临艰难的权衡:要么过度配置计算资源以应对极端情况(导致 80% 的时间中 GPU 资源闲置,造成资本浪费),要么配置不足,进而在需求激增时面临服务降级、超时和请求丢失的风险,最终影响用户体验。
本文将为您介绍如何在 RAG Blueprint 中,针对一个关键的 RAG 用例——具有严格性能负载和延迟要求的客户服务聊天机器人(ISL/OSL 256/256)——实现对关键 NVIDIA NIM 微服务 的自动扩展。文章详细说明了如何结合使用 Kubernetes 横向 Pod 自动缩放(HPA) 与以下 NVIDIA NIM 微服务:Nemotron LLM、Nemotron Rerank 和 Nemotron Embed,并利用可用的自定义指标,实现微服务的动态伸缩。通过该方法,您能够在应用需求所定义的限制和服务级别协议(SLA)范围内,高效地自动扩展 NIM 微服务。
RAG 系统的工作原理是什么?
在 Kubernetes 生产环境中,必须充分了解计算和内存配置文件,以及端到端 RAG 系统及其各个组件的性能特征。延迟和吞吐量等指标是服务扩展与集群资源规划的重要依据。
每个用例(由 ISL/OSL 定义)都需要不同的性能负载、并发性,以及延迟 SLA 要求,即“到达第一个 XX 的时间”__ XTOKENX_XX(TTFT)和“端到端请求延迟”(e2e_latency)。
下文概述了若干 RAG 用例的性能与延迟 SLA 要求。请注意,本文为三个典型用例设定了相应的 ISL/OSL 典型值,但仅聚焦于第一个用例,即客户服务聊天机器人。
- 客户服务聊天机器人 (ISL/ OSL 256/ 256): 需要将并发请求从 100 个扩展到 300 个并发请求 (CR) 并实现快速响应,因为这对客户体验有直接影响。要求首令牌时间低于 2 秒 (TTFT = 2 秒),端到端响应时间低于 20 秒 (e2e_latency = 20 秒)。
- 电子邮件摘要服务 (ISL/ OSL 2048/ 1024): 可能需要较低的并发请求量 (CR = 100),且对响应时间的要求相对宽松 (TTFT = 10 秒,e2e_latency = 40 秒)。
- 研究智能体 (ISL/ OSL 512/ 4096): 可能需要更低的并发请求量 (CR = 25),且整体响应时间的服务横向协议更为宽松 (e2e_latency = 120 秒),因为跨数据源的研究与报告生成本质上属于较为异步的任务。
在 RAG 系统中,包含三个不同的阶段:提取、检索和生成答案。处理用户查询时,大致流程包括检索结果、对结果进行排序,以及利用大语言模型(LLM)基于检索结果生成答案。观察 RAG 工作流的延迟指标后发现,LLM NIM 是导致服务延迟的主要因素,其次是重新排序 NIM。每当负载(以并发请求数量或队列深度衡量)显著增加,导致用例延迟超出 SLA 要求(例如 TTFT > 2s)时,便需要对 LLM NIM 进行横向扩展。
当检索重排序负载较高(数百个并发请求)且 GPU 使用容量超过 75% 时,需对重排序 NIM 进行横向扩展;当嵌入请求负载极高(数千个并发请求)且 GPU 使用容量超过 75% 时,需对嵌入 NIM 进行横向扩展。
对于 RAG 提取工作流,嵌入 NIM 和向量 DB 索引可能成为延迟瓶颈。为降低向量 DB 的延迟开销,RAG Blueprint 采用支持 GPU 加速的 Milvus 向量数据库,并利用GPU CAGRA和NVIDIA cuVS进行索引构建。然而,在高吞吐写入负载期间,当需要同时嵌入数千个数据块时,必须对嵌入 NIM 进行横向扩展。
如何自动扩展 RAG 检索工作流
以下教程重点介绍如何针对要求最高的客户服务聊天机器人(ISL/OSL 256/256)用例,实现 RAG 检索工作流的自动扩展。该场景需支持并发 CR = 300,并确保首字响应延迟 TTFT ≤ 2 秒。我们将通过 Kubernetes Horizontal Pod Autoscaler (HPA) 对 LLM NIM 进行横向扩展,并使用 GenAI-Perf 工具生成相应负载。
为了实现 LLM NIM 的自动扩展,我们将利用可用的并发数和 KV 缓存指标,并基于 TTFT p90 构建第 90 百分位的自定义延迟指标。此外,在请求负载较高且 GPU 利用率达到峰值时,我们将重新评估重排序 NIM 和嵌入 NIM 的自动扩缩容策略。
预备知识
本教程的预备知识包括:
- 用于生成 API 密钥的 NGC 帐户
- 具备对 Kubernetes 集群管理权限的管理员账户
- Kubernetes 命令行工具 kubectl 已安装
- Helm 命令行工具 已安装
- 已按照《Kubernetes 上 NVIDIA NIM 微服务的横向自动缩放》中的说明,完成 Metrics Server、Prometheus、Prometheus Adapter 和 Grafana 的部署与配置
第 1 步:部署 NVIDIA RAG Blueprint
在测试中,我们部署并使用了 NVIDIA RAG Blueprint。该 Blueprint 是基础 RAG 工作流的开源参考实现。
要部署该blueprint,请按照包含 Helm 部署选项的快速入门说明进行操作。有关此blueprint所含内容的更多详细信息及高级架构说明,请参阅 NVIDIA-AI-Blueprints/rag GitHub 存储库。总体而言,此blueprint包含两种类型的容器:
- NVIDIA NIM 微服务,用于模型托管
- “Glue Code”容器,负责集成这些 NIM 微服务的逻辑
要执行 RAG 检索,需先创建 Milvus 向量数据库集合并完成数据提取。随后,通过 NVIDIA RAG Blueprint 提供的 RAG UI 门户,使用下方的 port-forward 命令,并将浏览器指向 localhost:3000。
在用户界面中创建集合 multimodal_data,并上传相关文档。
kubectl -n <namespace> port-forward svc/<service-name> <local-port>:<service-port>kubectl port-forward -n rag svc/rag-frontend 3000:3000 |
第 2 步:启用可观察性指标
部署后,请注意已部署的 NIM for LLM 微服务的服务名称和命名空间,这些信息将用于多个命令。
LLM NIM 通过 Prometheus 服务端点 service port:8000 prefix:/v1/metrics 公开了一系列丰富的可观察性指标。若要查看指标端点,可使用以下命令将服务端口转发到本地主机 local-port: 8080:
kubectl -n <namespace> port-forward svc/<service-name> <local-port>:<service-port>kubectl -n rag port-forward svc/rag-nim-llm 8080:8000 |
如需了解 LLM NIM 指标,请访问 http://localhost:8080/v1/metrics 。以下关键指标可用于自动缩放,后续将在博文中提及:
-
num_requests_running: Measures the concurrency or concurrent requests (CRs), the number of active requests that the LLM pod is currently servicing. It is a measure of processing load on the LLM service. -
time_to_first_token: Measures the time taken (in seconds) to receive the first response token from the LLM after sending the user query. It is a measure of latency of the LLM service. TTFT is reported as a histogram with different buckets (time_to_first_token_seconds_bucket) 1 ms, 5 ms, 10 ms, 20 ms, 40 ms, 60 ms, 80 ms, 100 ms, 250 ms, 500 ms, 750 ms, 1 s, 2.5 s, 5 s, 7.5 s, 10 s, infinity+. -
gpu_cache_usage_perc: Measures the percentage of KV cache (GPU inference memory) used by the LLM for processing the current requests. It is a measure of processing load on the LLM service.
# HELP num_requests_running Number of requests currently running on GPU.# TYPE num_requests_running gaugenum_requests_running{model_name="nvidia/llama-3.3-nemotron-super-49b-v1.5"} 0.0# HELP gpu_cache_usage_perc GPU KV-cache usage. 1 means 100 percent usage.# TYPE gpu_cache_usage_perc gaugegpu_cache_usage_perc{model_name="nvidia/llama-3.3-nemotron-super-49b-v1.5"} 0.0# HELP time_to_first_token_seconds Histogram of time to first token in seconds.# TYPE time_to_first_token_seconds histogramtime_to_first_token_seconds_sum{model_name="nvidia/llama-3.3-nemotron-super-49b-v1.5"} 31385.349472999573time_to_first_token_seconds_bucket{le="0.001",model_name="nvidia/llama-3.3-nemotron-super-49b-v1.5"} 0.0time_to_first_token_seconds_bucket{le="0.005",model_name="nvidia/llama-3.3-nemotron-super-49b-v1.5"} 0.0time_to_first_token_seconds_bucket{le="0.01",model_name="nvidia/llama-3.3-nemotron-super-49b-v1.5"} 0.0time_to_first_token_seconds_bucket{le="0.02",model_name="nvidia/llama-3.3-nemotron-super-49b-v1.5"} 0.0time_to_first_token_seconds_bucket{le="0.04",model_name="nvidia/llama-3.3-nemotron-super-49b-v1.5"} 0.0time_to_first_token_seconds_bucket{le="0.06",model_name="nvidia/llama-3.3-nemotron-super-49b-v1.5"} 0.0time_to_first_token_seconds_bucket{le="0.08",model_name="nvidia/llama-3.3-nemotron-super-49b-v1.5"} 0.0time_to_first_token_seconds_bucket{le="0.1",model_name="nvidia/llama-3.3-nemotron-super-49b-v1.5"} 0.0time_to_first_token_seconds_bucket{le="0.25",model_name="nvidia/llama-3.3-nemotron-super-49b-v1.5"} 5681.0time_to_first_token_seconds_bucket{le="0.5",model_name="nvidia/llama-3.3-nemotron-super-49b-v1.5"} 19593.0time_to_first_token_seconds_bucket{le="0.75",model_name="nvidia/llama-3.3-nemotron-super-49b-v1.5"} 26800.0time_to_first_token_seconds_bucket{le="1.0",model_name="nvidia/llama-3.3-nemotron-super-49b-v1.5"} 30598.0time_to_first_token_seconds_bucket{le="2.5",model_name="nvidia/llama-3.3-nemotron-super-49b-v1.5"} 35405.0time_to_first_token_seconds_bucket{le="5.0",model_name="nvidia/llama-3.3-nemotron-super-49b-v1.5"} 36189.0time_to_first_token_seconds_bucket{le="7.5",model_name="nvidia/llama-3.3-nemotron-super-49b-v1.5"} 36567.0time_to_first_token_seconds_bucket{le="10.0",model_name="nvidia/llama-3.3-nemotron-super-49b-v1.5"} 36772.0time_to_first_token_seconds_bucket{le="+Inf",model_name="nvidia/llama-3.3-nemotron-super-49b-v1.5"} 37027.0time_to_first_token_seconds_count{model_name="nvidia/llama-3.3-nemotron-super-49b-v1.5"} 37027.0 |
同样,Nemotron 重排序和嵌入 NIM 微服务通过 Prometheus 指标端点 (service-port:8000 prefix:/v1/metrics) 公开指标。要查看该指标端点,可使用 port-forward 将服务发送至 localhost local-port: 8081,8082。
kubectl -n <namespace> port-forward svc/<service-name> <local-port>:<service-port>kubectl -n rag port-forward svc/nim-reranking 8081:8000kubectl -n rag port-forward svc/nim-embedding 8082:8000 |
有关重新排序 NIM 指标的信息,请访问 http://localhost:8081/v1/metric ;有关嵌入 NIM 指标的信息,请访问 http://localhost:8082/v1/metrics 。
对于自动扩展 Nemotron 嵌入和重新排序 NIM 微服务,本文采用 GPU 资源使用指标 (gpu_utilization)。
# HELP gpu_power_usage_watts GPU instantaneous power, in watts# TYPE gpu_power_usage_watts gaugegpu_power_usage_watts{device_id="0"} 97367.0# HELP gpu_power_limit_watts Maximum GPU power limit, in watts# TYPE gpu_power_limit_watts gaugegpu_power_limit_watts{device_id="0"} 600000.0# HELP gpu_total_energy_consumption_joules GPU total energy consumption, in joules# TYPE gpu_total_energy_consumption_joules gaugegpu_total_energy_consumption_joules{device_id="0"} 1.69608380193e+08# HELP gpu_utilization GPU utilization rate (0.0 - 1.0)# TYPE gpu_utilization gaugegpu_utilization{device_id="0"} 0.0# HELP gpu_memory_total_bytes Total GPU memory, in bytes# TYPE gpu_memory_total_bytes gaugegpu_memory_total_bytes{device_id="0"} 1.50754820096e+011# HELP gpu_memory_used_bytes Used GPU memory, in bytes# TYPE gpu_memory_used_bytes gaugegpu_memory_used_bytes{device_id="0"} 4.49445888e+09 |
第 3 步:为 NIM 微服务创建 ServiceMonitor
为所有 NIM 微服务创建 ServiceMonitor 以抓取指标,并将其在 Prometheus 中提供给 Kubernetes HPA,用于实现自动扩展。您需要确定 Prometheus 服务的版本标签、NIM 服务的标签名称以及服务端口。
首先,找到 Prometheus 服务 release 标签:
kubectl get svc kube-prometheus-stack-prometheus -n prometheus -o yaml | grep labels -A 10# Command output labels: app: kube-prometheus-stack-prometheus release: kube-prometheus-stack # Prometheus stack ‘release’ label to set in ServiceMonitor labels self-monitor: "true" name: kube-prometheus-stack-prometheuskubectl get svc kube-prometheus-stack-prometheus -n prometheus -o jsonpath='{.metadata.labels.release}'# Command outputkube-prometheus-stack |
接下来,查找 LLM NIM 的服务端口及服务标签:
kubectl get svc -n rag -o yaml rag-nim-llm# command outputapiVersion: v1kind: Servicemetadata: name: rag-nim-llm namespace: rag labels: app: rag-nim-llm # LLM NIM service label to use in ServiceMonitor selectorspec: ports: - name: service-port # LLM NIM service port name to use in ServiceMonitor endpoints port: 8000 protocol: TCP targetPort: 8000 selector: app: rag-nim-llm type: ClusterIp# alternate command to get just the port namekubectl get svc rag-nim-llm -n rag -o jsonpath='{.spec.ports[*].name}'service-port |
然后,利用上述步骤中的信息创建 Service Monitor:
kubectl apply -f - <<EOFapiVersion: monitoring.coreos.com/v1kind: ServiceMonitormetadata: name: rag-nim-llm namespace: rag labels: release: kube-prometheus-stack # match the prometheus stack ‘release’ labelspec: endpoints: - port: service-port # The name of the port defined in your NIM Service path: /v1/metrics # The path where metrics are exposed; NIMs use /v1/metrics interval: 30s # How often Prometheus should scrape metrics namespaceSelector: matchNames: - rag # the namespace where your LLM NIM service resides selector: matchLabels: app: rag-nim-llm # match the LLM NIM service label(s)EOF |
重复以下步骤,为重新排序和嵌入 NIM 微服务创建服务监视器:
# service monitor for reranking NIMkubectl apply -f - <<EOFapiVersion: monitoring.coreos.com/v1kind: ServiceMonitormetadata: name: nim-reranking namespace: rag labels: release: kube-prometheus-stack # match the prometheus stack ‘release’ labelspec: endpoints: - port: service-port # The name of the port defined in your NIM Service path: /v1/metrics # The path where metrics are exposed; NIMs use /v1/metrics interval: 30s # How often Prometheus should scrape metrics namespaceSelector: matchNames: - rag # the namespace where your reranking NIM service resides selector: matchLabels: app: nim-reranking # match the reranking NIM service label(s)EOF# service monitor for embedding NIMkubectl apply -f - <<EOFapiVersion: monitoring.coreos.com/v1kind: ServiceMonitormetadata: name: nim-embedding namespace: rag labels: release: kube-prometheus-stack # match the prometheus stack ‘release’ labelspec: endpoints: - port: service-port # The name of the port defined in your NIM Service path: /v1/metrics # The path where metrics are exposed; NIMs use /v1/metrics interval: 30s # How often Prometheus should scrape metrics namespaceSelector: matchNames: - rag # the namespace where your embedding NIM service resides selector: matchLabels: app: nim-embedding # match the embedding NIM service label(s)EOF |
第 4 步:使用 TTFT p90 自动扩展 LLM NIM
在第一个用例中,我们将为 LLM NIM 创建自定义指标,以实现基于延迟值 TTFT 的自动缩放。对于延迟敏感型 RAG 用例,TTFT 指标是至关重要的衡量标准。它表示 RAG 服务处理用户查询并整合向量数据库提供的所有相关上下文所需的时间,只有完成该过程后,系统才能对查询作出响应。
对于客服聊天机器人用例,将采用第 90 百分位的 TTFT 超过 2 秒(TTFT p90 > 2s)作为延迟 SLA,以触发 LLM NIM 的扩缩容。
验证 Prometheus 查询的直方图指标
要验证 Prometheus 查询,可先将 Prometheus 服务端点 service port:9090 prefix:/query 的端口转发至 localhost。
kubectl port-forward -n <prometheus-namespace> svc/<prometheus-service-> 9090:9090 kubectl port-forward -n prometheus svc/kube-prometheus-stack-prometheus 9090:9090 |
然后,将浏览器导航至 http://localhost:9090/query?,添加要查询的指标,然后单击“Execute” (执行)。如需绘制指标图形,请选择“Graph” (图形) 选项卡。
为 TTFT 直方图指标 time_to_first_token_seconds_bucket 设置 Prometheus 查询,以显示所有存储桶的数量,或选择特定存储桶 <=1s time_to_first_token_seconds_bucket{le=”1.0”}。

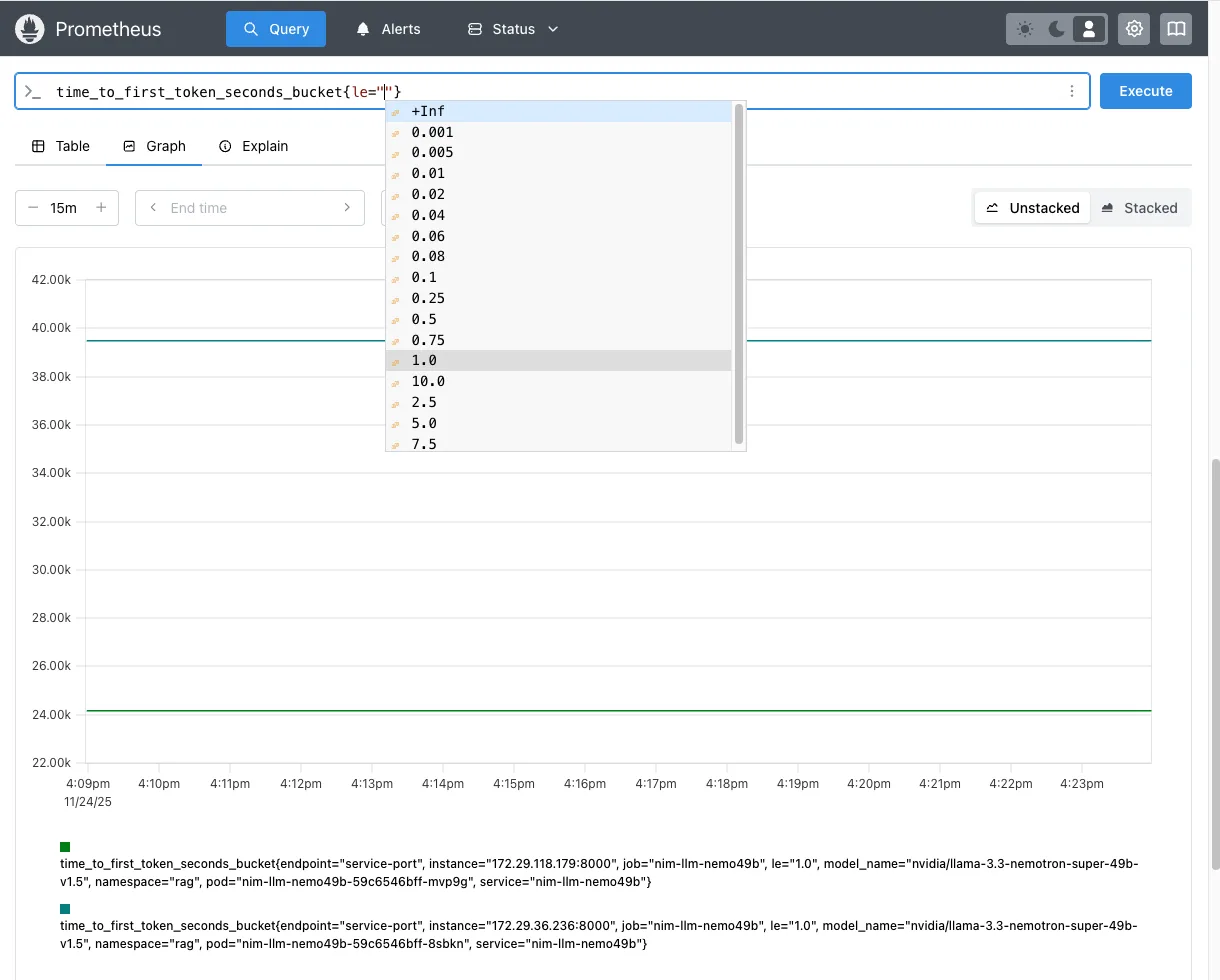
time_to_first_token_seconds_bucket{le=”1.0”} 的 Prometheus 图形您还可以使用 curl 查询 Prometheus 指标:
curl -s 'http://localhost:9090/api/v1/query' --data-urlencode 'query=time_to_first_token_seconds_bucket{namespace="rag",service="rag-nim-llm",le="1.0"}' | jq .{ "status": "success", "data": { "resultType": "vector", "result": [ { "metric": { "__name__": "time_to_first_token_seconds_bucket", "endpoint": "service-port", "instance": "172.29.36.236:8000", "job": "rag-nim-llm-0", "le": "1.0", "model_name": "nvidia/llama-3.3-nemotron-super-49b-v1.5", "namespace": "rag", "pod": "rag-nim-llm-0", "service": "rag-nim-llm" }, "value": [ 1764017343.481, "39502" ] }, { "metric": { "__name__": "time_to_first_token_seconds_bucket", "endpoint": "service-port", "instance": "172.29.118.179:8000", "job": "rag-nim-llm-1, "le": "1.0", "model_name": "nvidia/llama-3.3-nemotron-super-49b-v1.5", "namespace": "rag", "pod": "rag-nim-llm-1”, "service": "rag-nim-llm }, "value": [ 1764017343.481, "24207" ] } ] }} |
更新查询,使用 histogram_quantile 获取过去 1 分钟内对 rag 命名空间中的 rag-nim-llm 服务的所有请求的第 90 百分位 TTFT 延迟(以秒为单位)。
histogram_quantile(0.90, sum(rate(time_to_first_token_seconds_bucket{namespace="rag", service="rag-nim-llm"}[1m])) by (le)) |
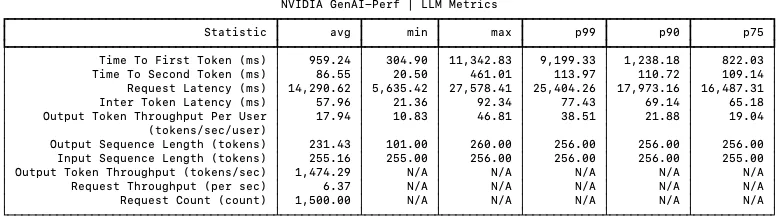
使用 NVIDIA GenAI 性能 工具(详细脚本和步骤如下)施加负载,并执行基准 RAG 检索性能测试。基于前述 Prometheus 查询,将并发负载设为 100 个并发请求(CR = 100),多次运行测试,以获取图 2 所示的 TTFT p90 延迟曲线。

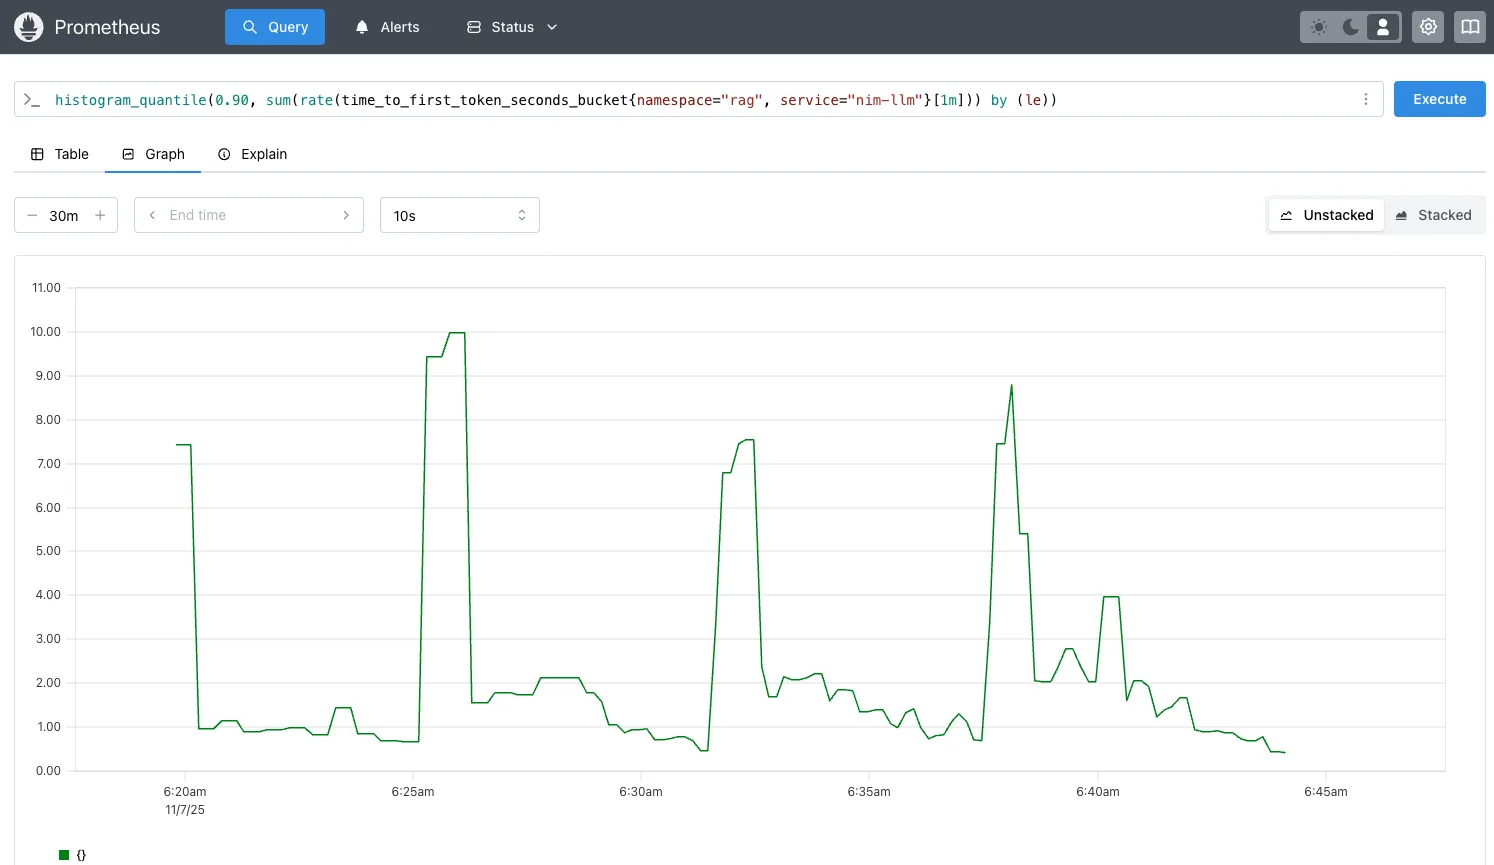
histogram_quantile TTFT 第 90 百分位的 Prometheus 图表执行以下步骤:创建自定义指标 time_to_first_token_p90,将其添加到 prometheus-adapter 中,然后为使用该指标进行扩展的 LLM NIM 创建 HPA 资源。
要添加自定义指标 time_to_first_token_p90,您需要更新该新指标,或将其追加到已存在的 prometheus-adapter 自定义指标中(如果该指标存在)。
备份遵循 ConfigMap 规则的现有 prometheus-adapter 自定义指标,并保存即将更新的副本 prometheus-adapter-new-rules.yaml。
kubectl get configmap prometheus-adapter -n prometheus -o yaml > prometheus-adapter-rules-backup.yamlcp prometheus-adapter-rules-backup.yaml prometheus-adapter-new-rules.yaml |
然后,编辑 prometheus-adapter-new-rules.yaml,并将其添加至现有规则或自定义指标中。
为自定义指标 time_to_first_token_p90 添加新规则::
apiVersion: v1kind: ConfigMapmetadata: name: prometheus-adapter namespace: prometheusdata: config.yaml: | rules: # TTFT p90 - 90th percentile TTFT metric - seriesQuery: 'time_to_first_token_seconds_bucket{namespace="rag"}' resources: overrides: namespace: {resource: "namespace"} service: {resource: "service"} name: matches: "^time_to_first_token_seconds_bucket$" as: "time_to_first_token_p90" metricsQuery: | histogram_quantile(0.90, sum(rate(time_to_first_token_seconds_bucket{<<.LabelMatchers>>}[1m])) by (le, namespace, service)) |
接下来,应用自定义指标 prometheus-adapter-new-rules.yaml。重启 Prometheus Adapter,并等待 30 秒,以确保 pod 已准备就绪。
kubectl apply -f prometheus-adapter-new-rules.yaml -n prometheuskubectl rollout restart deployment prometheus-adapter -n prometheus |
验证此自定义 metric time_to_first_token_p90 是否可用于从指标服务器获取查询结果:
kubectl get --raw "/apis/custom.metrics.k8s.io/v1beta1/namespaces/rag/services/*/time_to_first_token_p90" | jq .{ "kind": "MetricValueList", "apiVersion": "custom.metrics.k8s.io/v1beta1", "metadata": {}, "items": [ { "describedObject": { "kind": "Service", "namespace": "rag", "name": "rag-nim-llm", "apiVersion": "/v1" }, "metricName": "time_to_first_token_p90", "timestamp": "2025-11-07T14:33:53Z", "value": "2228m", "selector": null } ]} |
接下来,创建 LLM NIM HPA 资源 nim-llm-hpa.yaml,以便基于该自定义指标 time_to_first_token_p90 实现自动扩展:
apiVersion: autoscaling/v2kind: HorizontalPodAutoscalermetadata: name: nim-llm-hpa namespace: ragspec: scaleTargetRef: apiVersion: apps/v1 kind: Statefulset name: rag-nim-llm minReplicas: 1 maxReplicas: 6 metrics: - type: Object object: metric: name: time_to_first_token_p90 describedObject: apiVersion: v1 kind: Service name: rag-nim-llm target: type: Value value: "2" # Scale when TTFT p90 > 2 seconds |
应用 LLM NIM HPA 资源 nim_llm_hpa.yaml:
kubectl apply -f rag_nim_llm_hpa.yaml -n rag |
验证是否已应用 LLM NIM HPA:
kubectl get hpa -n rag NAME REFERENCE TARGETS MINPODS MAXPODS REPLICAS AGEnim-llm-hpa StatefulSet/rag-nim-llm 0/1 1 6 1 32s |
第 5 步:使用 GenAI-Perf 生成流量负载
使用 GenAI-Perf 或 AI Perf 生成流量,以模拟 RAG 生态系统中的负载情况。您可参照 Kubernetes 上 NVIDIA NIM 微服务的横向自动扩缩容方法,在集群中运行 Pod。
运行下方所示的 rag-sweep-hpa.sh 脚本,通过并发请求(CR = 50、100、150、200、250、300)测试,在 TTFT p90 超过 2 秒(TTFT p90 > 2s)时,自动将 LLM NIM 服务从 1 扩展至 6。
在此用例中,每当并发率上升 50% 时,TTFT p90 将超过 2 秒,从而触发 LLM NIM 的 HPA 及自动扩缩容机制。通过设置每次并发请求数量为 request_multiplier = 15,可在下一次横向扩展触发前,为 LLM NIM 留出充足的准备时间。
LLM NIM 横向扩展并准备就绪所需的时间取决于模型大小(8B 与 49B)、是否启用了图像的 NIM 缓存,以及用于缓存 NIM 的存储类型。相比基于 NFS 的远程文件存储,使用块存储(如 longhorn.io 或 rook ceph)可减少数分钟的停机时间,并加快 LLM NIM Pod 的启用速度。
#!/bin/bashexport RAG_SERVICE="rag-server:8081" #rag-server:portexport NIM_MODEL="nvidia/llama-3.3-nemotron-super-49b-v1.5" export NIM_MODEL_NAME="llama-3_3-nemotron-super-49b-v1.5" export NIM_MODEL_TOKENIZER="nvidia/Llama-3_3-Nemotron-Super-49B-v1" export CONCURRENCY_RANGE="50 100 150 200 250 300" #loop through the concurrency range to autoscale nim-llmexport request_multiplier=15 #number of requests per concurrency#RAG specific parameters sent to rag-serverexport ISL="256" # Input Sequence Length (ISL) inputs to sweep overexport OSL="256" # Output Sequence Length (OSL) inputs to sweep overexport COLLECTION="multimodal_data"export VDB_TOPK=10export RERANKER_TOPK=4export OUTPUT_DIR="../results"for CR in ${CONCURRENCY_RANGE}; do total_requests=$((request_multiplier * CR)) EXPORT_FILE=RAG_CR-${CR}_ISL-${ISL}_OSL-${OSL}-$(date +"%Y-%m-%d-%H_%M_%S").json START_TIME=$(date +%s) genai-perf profile \ -m $NIM_MODEL_NAME \ --endpoint-type chat \ --streaming -u $RAG_SERVICE \ --request-count $total_requests \ --synthetic-input-tokens-mean $ISL \ --synthetic-input-tokens-stddev 0 \ --concurrency $CR \ --output-tokens-mean $OSL \ --extra-inputs max_tokens:$OSL \ --extra-inputs min_tokens:$OSL \ --extra-inputs ignore_eos:true \ --extra-inputs collection_name:$COLLECTION \ --extra-inputs enable_reranker:true \ --extra-inputs enable_citations:false \ --extra-inputs enable_query_rewriting:false \ --extra-inputs vdb_top_k:$VDB_TOPK \ --extra-inputs reranker_top_k:$RERANKER_TOPK \ --artifact-dir $OUTPUT_DIR \ --tokenizer $MODEL \ --profile-export-file $EXPORT_FILE \ -- -v --max-threads=$CR END_TIME=$(date +%s) elapsed_time=$((END_TIME - START_TIME)) echo "[$(date +"%Y-%m-%d %H:%M:%S")] Completed: $EXPORT_FILE in $elapsed_time seconds"done |

第 6 步:验证 LLM NIM 自动扩展
使用 rag-sweephpa.sh 脚本,通过调整并发次数(50、100、150、200、250 和 300)来多次运行流量生成。随着并发请求数量以 50 为步长递增,HPA 延迟指标 TTFT p90 会增加约 2 秒,随后 LLM NIM 将自动扩展。LLM NIM 需要一定时间(约 2 至 5 分钟)才能完成初始化并投入运行。
kubectl get hpa -n rag -wNAME REFERENCE TARGETS MINPODS MAXPODS REPLICAS AGEnim-llm-hpa StatefulSet/rag-nim-llm 845m/2 1 6 1 1dnim-llm-hpa StatefulSet/rag-nim-llm 1455m/2 1 6 1 1dnim-llm-hpa StatefulSet/rag-nim-llm 2317m/2 1 6 2 1d >> LLM autoscale outnim-llm-hpa StatefulSet/rag-nim-llm 710m/2 1 6 2 1dnim-llm-ttft StatefulSet/rag-nim-llm 2151m/2 1 6 3 1d >> LLM autoscale out |
验证 LLM NIM Pod 的数量是否已自动扩容,以及新 Pod 是否可用:
kubectl get pods -n rag | grep rag-nim-llmNAME READY STATUS RESTARTS AGErag-nim-llm-0 1/1 Running 0 10mrag-nim-llm-1 1/1 Running 0 5mrag-nim-llm-2 1/1 Running 0 3m |
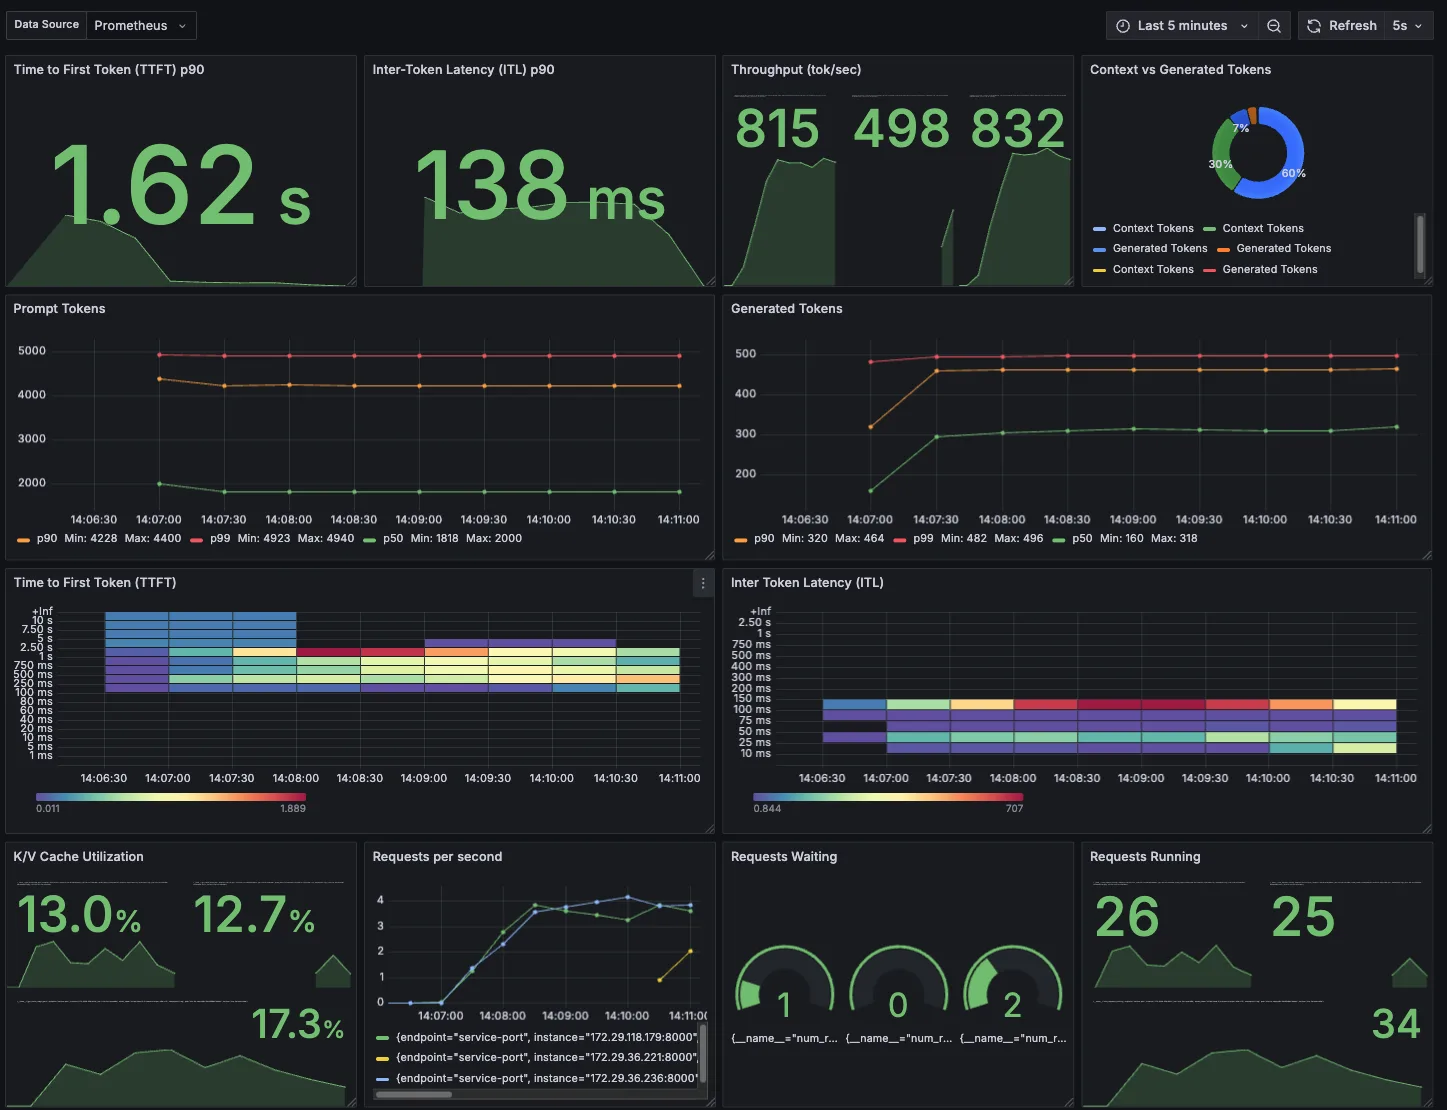
导入适用于 LLM NIM 的 Grafana 控制面板,以便在 TTFT p90 超过 2 秒时进行横向扩展,并在所有 LLM NIM Pod 中查看 LLM NIM 服务的 TTFT p90 负载情况。

HPA 也会随着时间的推移而缩减。缩小前的等待时间由 --horizontal-pod-autoscaler-downscale-stabilization 标志指定,默认为 5 分钟。这意味着规模缩小会逐步进行,以减少指标值快速波动带来的影响。等待 5 分钟后,再执行缩小操作。
第 7 步:HPA 纵向扩展和纵向缩小稳定
对于 LLM NIM HPA,定义纵向扩展(实现更快的响应速度)以及纵向缩减时的稳定性:
apiVersion: autoscaling/v2kind: HorizontalPodAutoscalermetadata: name: nim-llm-hpa namespace: ragspec: behavior: scaleUp: # Scale up faster response stabilizationWindowSeconds: 60 policies: # Allow up to 100% increase (double) every 30 seconds - type: Percent value: 100 periodSeconds: 30 # add 1 pod at a time - type: Pods value: 1 periodSeconds: 30 selectPolicy: Max scaleDown: # Stabilization with conservative scale down stabilizationWindowSeconds: 300 policies: # Max 50% decrease every 60 seconds - type: Percent value: 50 periodSeconds: 120 |
第 8 步:使用并发请求自动扩展 LLM NIM
要自动扩展 LLM NIM,前面列出了几个可用指标,包括 CR num_requests_running 和 KV cache gpu_cache_usage_perc 。
下一步是如何通过并发或队列深度实现扩展,即利用 LLM 使用 LLM NIM 指标 num_requests_running 来处理的 CR 数量。
首先,验证指标 num_requests_running 是否存在,并确认其是否可供 Kubernetes HPA 用于 LLM NIM 服务:
kubectl get --raw '/apis/custom.metrics.k8s.io/v1beta1/namespaces/rag/services/*/num_requests_running' | jq .{ "kind": "MetricValueList", "apiVersion": "custom.metrics.k8s.io/v1beta1", "metadata": {}, "items": [ { "describedObject": { "kind": "Service", "namespace": "rag", "name": "rag-nim-llm", "apiVersion": "/v1" }, "metricName": "num_requests_running", "timestamp": "2025-11-21T20:23:45Z", "value": "0", "selector": null } ]} |
创建或更新 LLM NIM HPA 资源 nim-llm-hpa.yaml,该资源利用并发指标 num_requests_running 实现 LLM NIM 的自动扩展,并应用 config。根据 config 的设定,当每个 LLM Pod 的平均 CR 超过 60 且每个 Pod 的平均请求数大于 60 时,HPA 将自动扩展 LLM NIM。
apiVersion: autoscaling/v2kind: HorizontalPodAutoscalermetadata: name: nim-llm-hpa namespace: ragspec: scaleTargetRef: apiVersion: apps/v1 kind: Statefulset name: rag-nim-llm minReplicas: 1 maxReplicas: 6 metrics: - type: Object object: metric: name: num_requests_running describedObject: apiVersion: v1 kind: Service name: rag-nim-llm target: type: AverageValue averageValue: "60" #scale when average concurrent requests >60 requests/pod |
将生成式 AI-Perf 负载与并发请求 CR = 50、100、150、200、250、300 结合,用于自动扩展 LLM NIM。同时监控 HPA 及 LLM NIM Pod 的运行状态。
kubectl get hpa -n rag -wNAME REFERENCE TARGETS MINPODS MAXPODS REPLICAS AGEnim-llm-hpa StatefulSet/nim-llm 48/60 (avg) 1 6 1 1dnim-llm-hpa StatefulSet/nim-llm 77/60 (avg) 1 6 2 1d >> LLM autoscale out |
使用来自 http://localhost:9090/query? 的 Prometheus 查询?对查询 num_requests_running 进行图形化处理,并获取支持自动缩放的图表(图 5)。
并发请求 CR = 150 时,请求将在两个 LLM 之间分配(例如,CR = 8565,平均每 Pod 的 num_requests_running = 75 个请求)。由于该值超过 HPA 扩容阈值(每个 Pod > 60 个请求),系统将自动扩展第三个 LLM。此时,并发请求 CR = 150 被均分至三个 LLM,即 5947,42;平均值 num_requests_running = 50,低于 HPA 目标值 60。

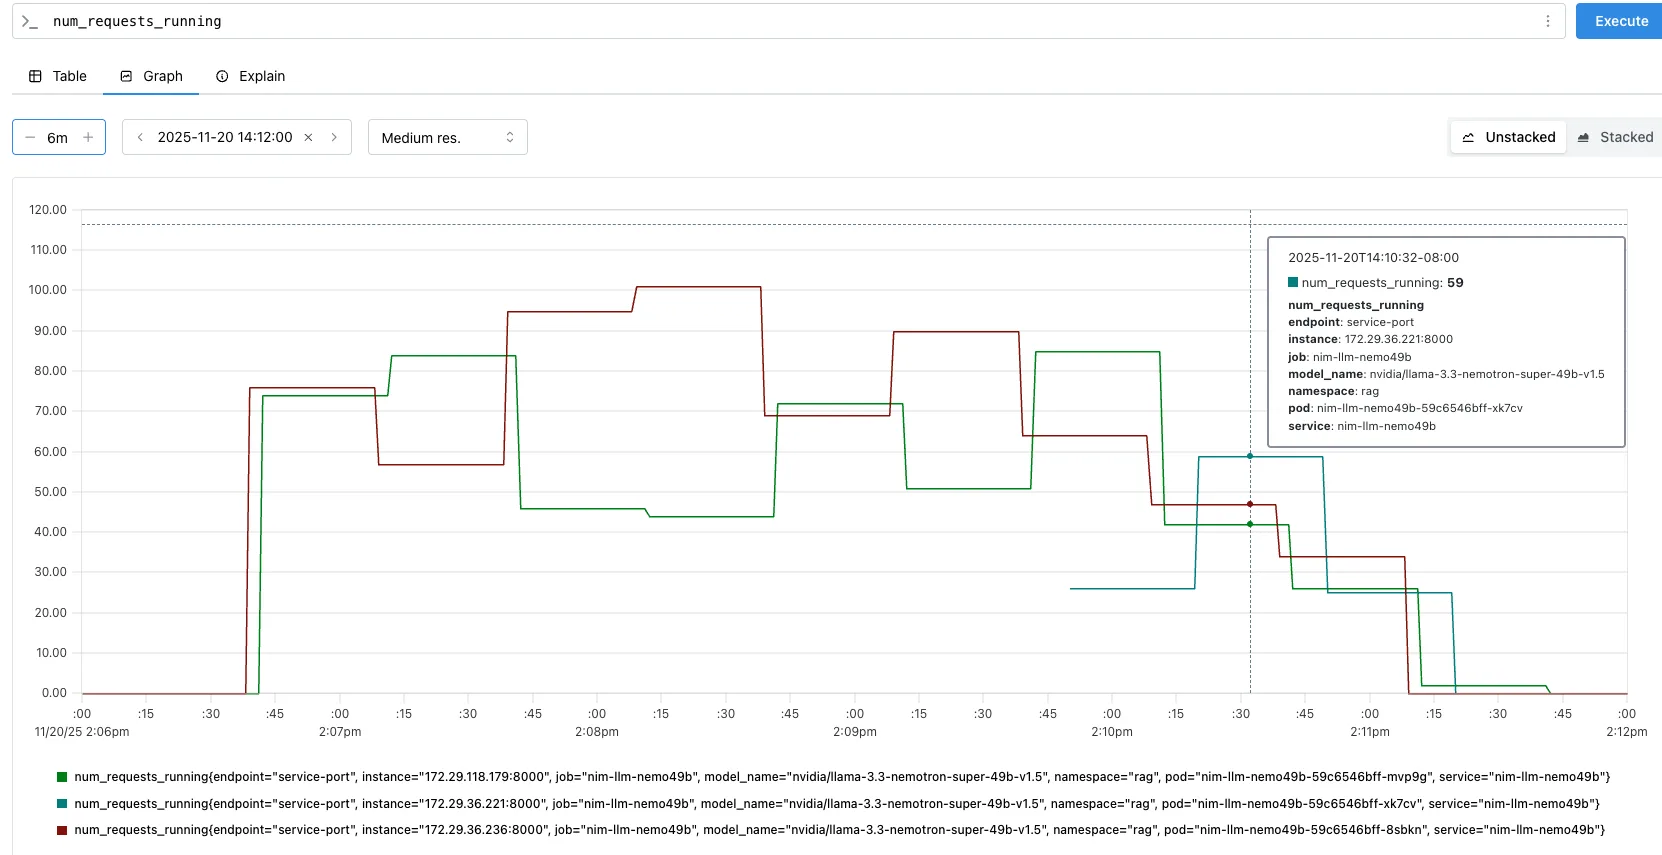
num_requests_running 在自动缩放并发请求(CR = 150)下的 Prometheus 图形第 9 步:根据 GPU 利用率自动扩展重排序和嵌入
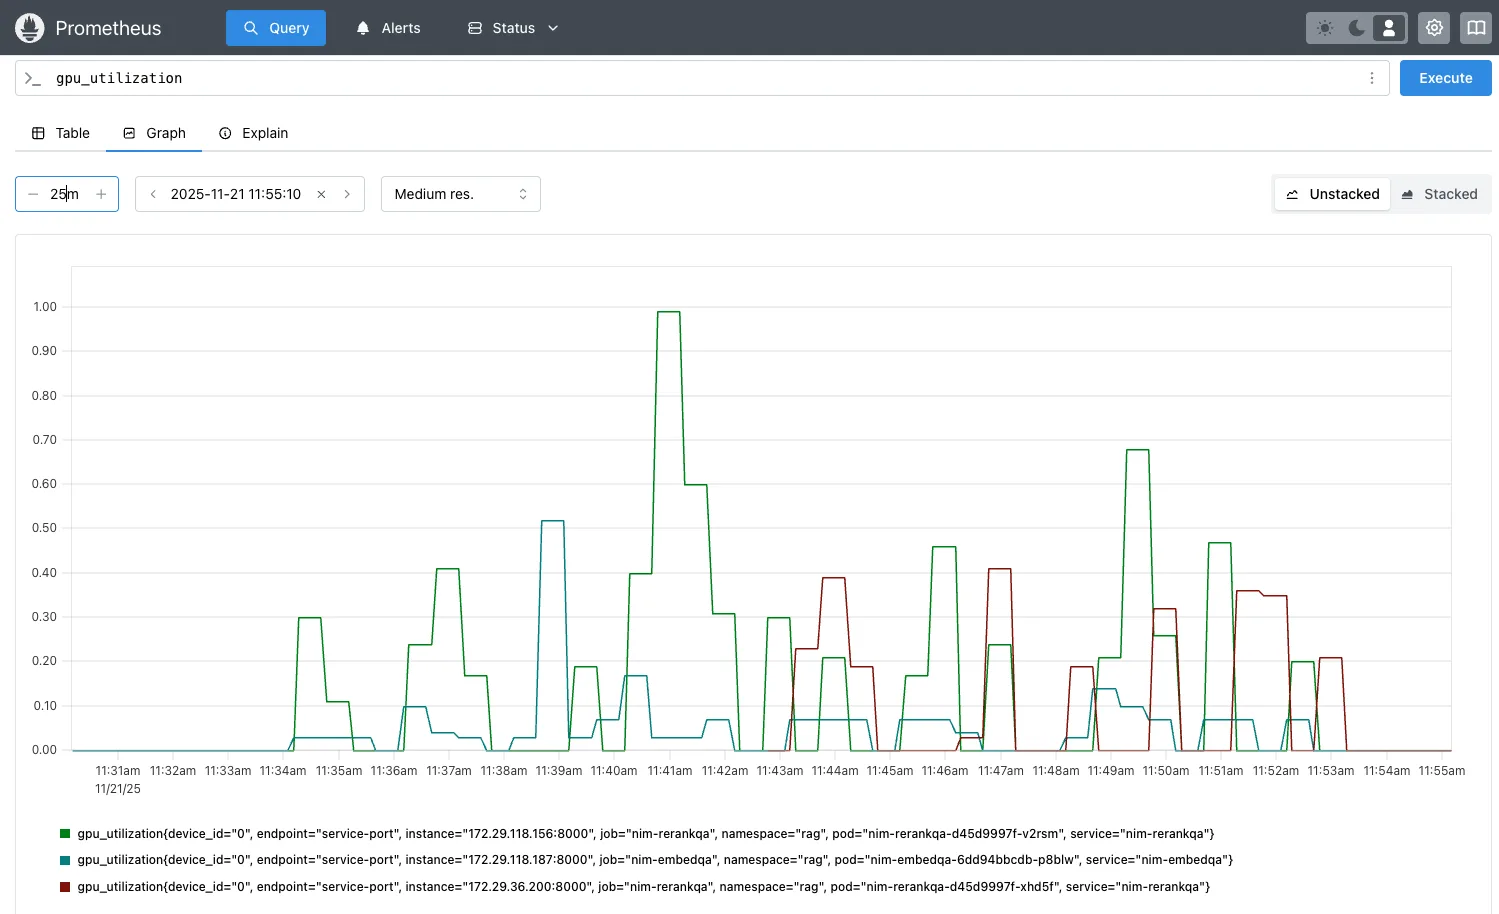
对于 RAG 检索工作流,可根据 GPU 使用指标 gpu_utilization 自动扩展 Nemotron 重排序和嵌入 NIM 微服务。该指标用于衡量处理、重新排序及嵌入请求所占用的 GPU 百分比。
首先,验证指标 gpu_utilization 是否存在,并确认其是否可供 Kubernetes HPA 使用,以支持嵌入和对 NIM 服务进行重排序:
kubectl get --raw '/apis/custom.metrics.k8s.io/v1beta1/namespaces/rag/services/*/gpu_utilization' | jq .{ "kind": "MetricValueList", "apiVersion": "custom.metrics.k8s.io/v1beta1", "metadata": {}, "items": [ { "describedObject": { "kind": "Service", "namespace": "rag", "name": "nim-embedding", "apiVersion": "/v1" }, "metricName": "gpu_utilization", "timestamp": "2025-11-24T03:01:21Z", "value": "0", "selector": null }, { "describedObject": { "kind": "Service", "namespace": "rag", "name": "nim-reranking", "apiVersion": "/v1" }, "metricName": "gpu_utilization", "timestamp": "2025-11-24T03:01:21Z", "value": "0", "selector": null } ]} |
使用 GPU 使用指标 gpu_utilization 创建 HPA nim-reranking-embedding-hpa.yaml,用于自动扩展重排序和嵌入 NIM 微服务,并应用相应配置。当每个 Pod 的平均 GPU 使用率超过 75% 时,HPA 将触发扩容操作。
apiVersion: autoscaling/v2kind: HorizontalPodAutoscalermetadata: name: nim-reranking-hpa namespace: ragspec: scaleTargetRef: apiVersion: apps/v1 kind: Deployment name: nim-reranking minReplicas: 1 maxReplicas: 3 metrics: - type: Object object: metric: name: gpu_utiliization describedObject: apiVersion: v1 kind: Service name: nim-reranking target: type: AverageValue averageValue: "0.75" #scale when average GPU usage >75% per pod---apiVersion: autoscaling/v2kind: HorizontalPodAutoscalermetadata: name: nim-embedding-hpa namespace: ragspec: scaleTargetRef: apiVersion: apps/v1 kind: Deployment name: nim-reranking minReplicas: 1 maxReplicas: 3 metrics: - type: Object object: metric: name: gpu_utiliization describedObject: apiVersion: v1 kind: Service name: nim-embedding target: type: AverageValue averageValue: "0.75" #scale when average GPU usage >75% per pod |
使用生成式 AI-Perf 负载处理并发请求 CR = 100、150、200、250、300,对重新排序的 NIM 进行自动扩展。当 CR = 200 时,由于并发负载较高,重新排序的 NIM 上的 GPU 利用率超过 75%,从而触发第二个重新排序的 NIM Pod 扩展,同时引发第四个 LLM NIM Pod 的自动扩展。
kubectl get hpa -n rag -wNAME REFERENCE TARGETS MINPODS MAXPODS REPLICAS AGEnim-embed Deployment/nim-embed 30m/750m (avg) 1 3 1 1dnim-llm-hpa StatefulSet/nim-llm 69/60 (avg) 1 6 4 1d >> LLM NIM autoscale outnim-rerank Deployment/nim-rerank 800m/750m (avg) 1 3 2 1d >> reranking NIM autoscale outkubectl get pods -n rag NAME READY STATUS RESTARTS AGEnim-embedding-6dd94bbcdb-p8blw 1/1 Running 0 1drag-nim-llm-3 1/1 Running 0 2m10s rag-nim-llm-0 1/1 Running 0 1d rag-nim-llm-2 1/1 Running 0 6m36s rag-nim-llm-1 1/1 Running 0 4m27s nim-reranking-d45d9997f-v2rsm 1/1 Running 0 1d nim-reranking-d45d9997f-xhd5f 0/1 ContainerCreating 0 33s |
使用 Prometheus 查询 http://localhost:9090/query??对查询 gpu_utilization 进行图形处理,并获取显示重新排序 NIM 的自动缩放的图形(图 6)。当 CR = 200 时,GPU 使用率指标 gpu_utilization 超过 75%,引发第二次重新排序 NIM 的自动缩放。

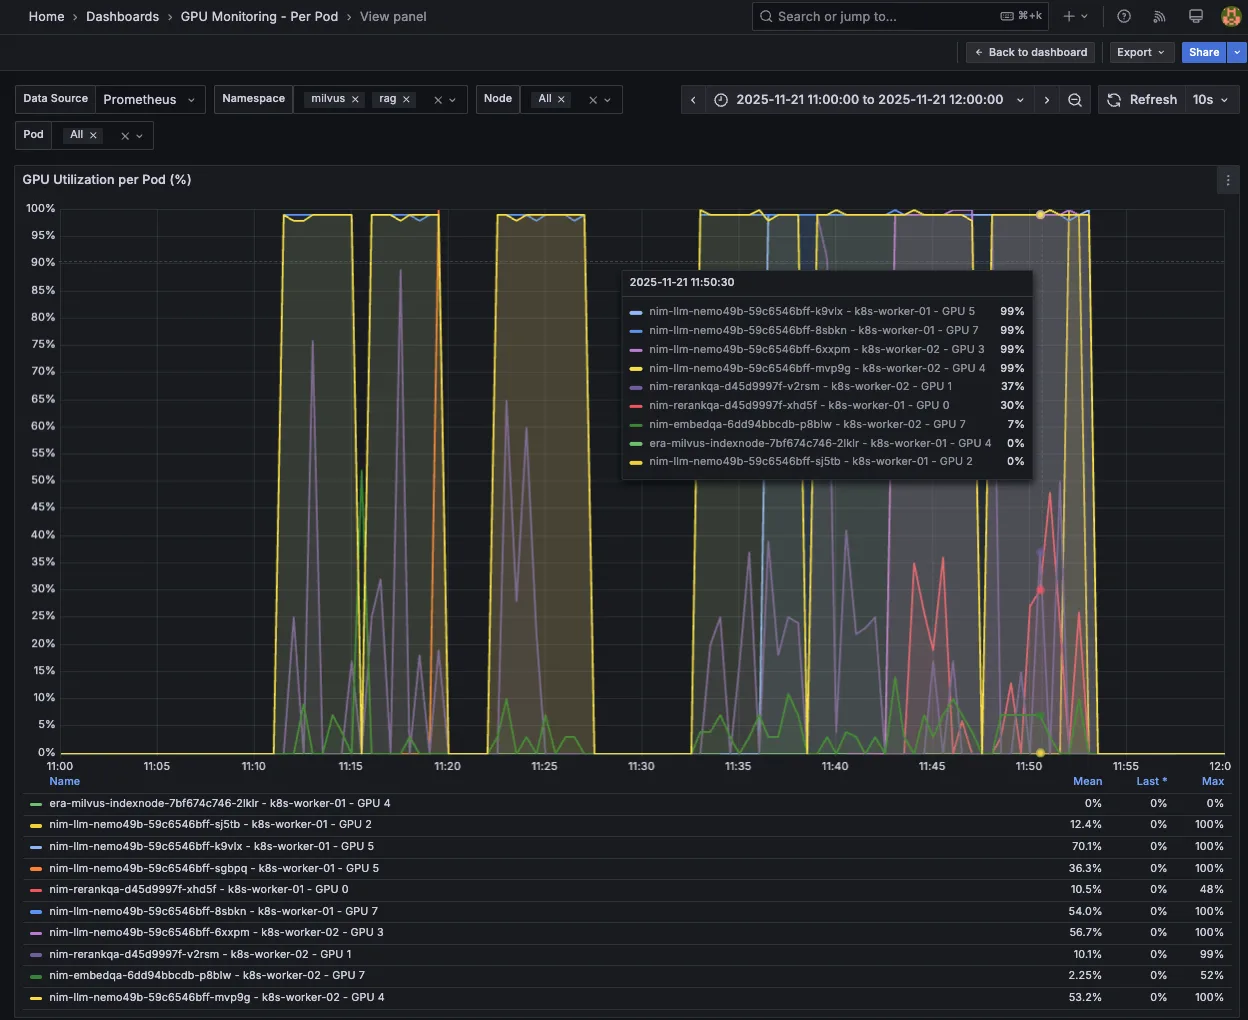
gpu_utilization > 75% 对 NIM 进行重新排序后的自动缩放情况图 7 显示了每个 Pod 的 GPU 利用率的 Grafana 控制面板,随着并发负载逐步增加(CR = 100、150、200、250 和 300),LLM NIM 从 1 个 Pod 自动扩展至 4 个 Pod,同时 NIM 也从 1 个 Pod 重新调度到 2 个 Pod。

开始在 Kubernetes 上实施横向自动扩缩
本文将介绍如何在 RAG 工作流中自动扩展关键的 NVIDIA NIM 微服务,以应对一个对性能负载和延迟要求较高的典型 RAG 用例,即客户服务聊天机器人(ISL/OSL 256/256)。
我们使用 Kubernetes HPA,基于可用指标和自定义指标自动扩展关键瓶颈 LLM NIM,包括以下内容:
- 并发: 并发请求的队列深度 (num_requests_running)
- KV 缓存: 请求处理时的缓存内存使用率 (gpu_cache_usage_perc)
- TTFT 自定义指标: TTFT p90 的第 90 百分位延迟 (time_to_first_token_p90)
我们还演示了如何利用 HPA 自动扩展重排序 NIM,并通过 GPU 资源使用率指标(gpu_utilization)将 NIM 与 LLM NIM 一同嵌入。
通过采用这些指标实现自动扩展,我们能够将 RAG 客户服务聊天机器人扩展至更高的并发级别 (CR = 300),同时维持延迟服务横向协议 (TTFT p90 ≤ 2s)。
要开始部署 RAG 并深入了解基于 NVIDIA RAG blueprint 的解决方案,请参考以下相关资源:
- NVIDIA 构建企业级 RAG Blueprint
- Kubernetes 上 NVIDIA NIM 微服务的横向自动扩展
- NVIDIA NeMo 检索器将精准的多模态 PDF 数据提取速度提升 15 倍
- 探索实现精准 AI 响应的高效分块策略


